
Choosing the best time to visit Moreton Island
The best time to visit Moreton Island is activity-dependent: camping, walking and a snorkelling boat trip place different demands on the weather. In the Cape Moreton long-term record, August to October is generally drier than most months from January to June. July is the coolest month, while September has the lowest average rainfall. Use that pattern to narrow your dates, then use the forecast to plan the actual outing.
These comparisons come from a lighthouse station rather than measurements at every beach or campsite. Use the marine forecast for the sea conditions on your chosen day. Keep your main objective clear: a guided water activity needs a different decision from an overnight camping stay. The snorkelling guide explains the wreck environment, and the camping guide covers the equipment and water arrangements that remain relevant in any month.
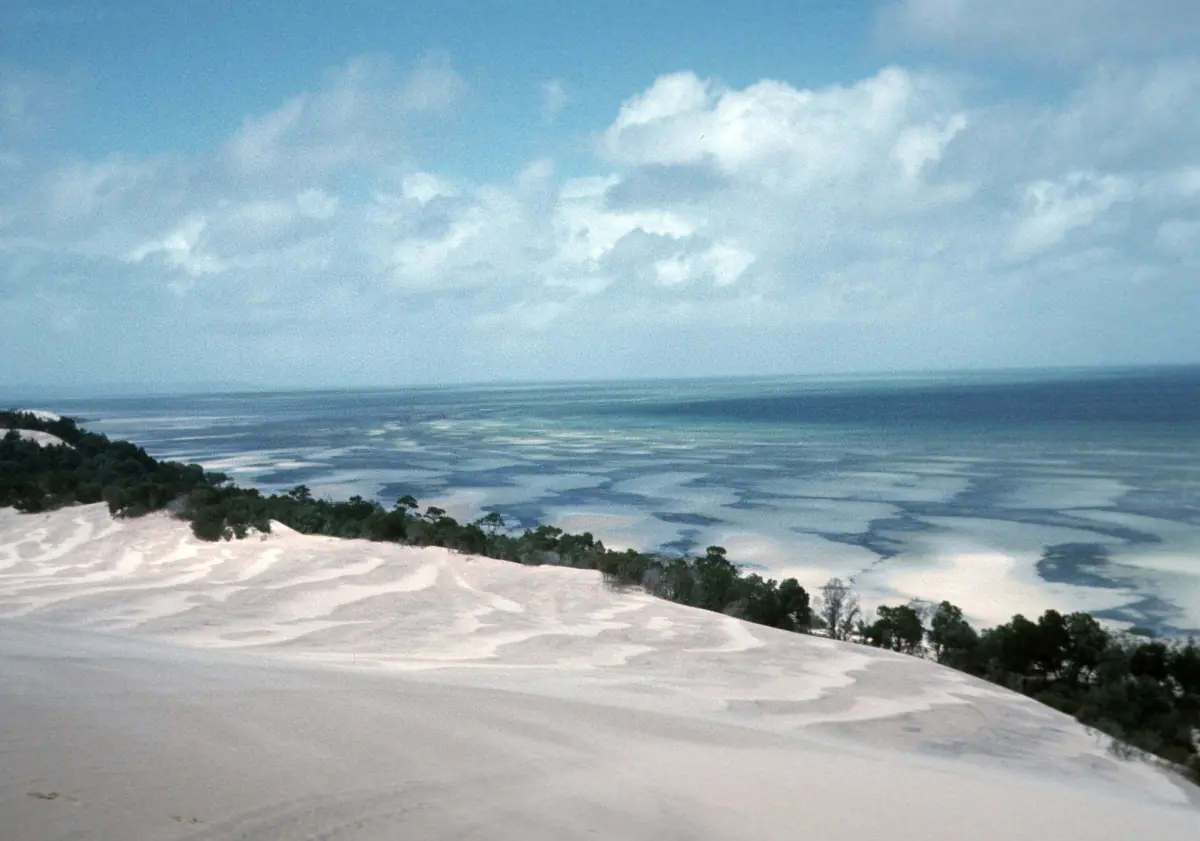
Moreton Island weather by month
The table uses the Bureau of Meteorology's All years of record statistics for station 040043, Cape Moreton Lighthouse. Mean temperatures cover 1910 to 2026; mean rainfall covers 1869 to 2026, with gaps in the record. This is a long-term series with different recording periods for temperature and rain. Maximum and minimum columns are mean daily temperatures, not record extremes; rainfall is the average monthly total.
| Month | Mean maximum °C | Mean minimum °C | Rainfall mm |
|---|---|---|---|
| January | 27.1 | 22.0 | 146.3 |
| February | 27.0 | 22.1 | 155.4 |
| March | 26.2 | 21.3 | 177.3 |
| April | 24.4 | 19.2 | 141.9 |
| May | 21.9 | 16.5 | 165.4 |
| June | 19.7 | 14.2 | 132.9 |
| July | 19.1 | 13.4 | 112.3 |
| August | 19.9 | 14.1 | 75.4 |
| September | 21.6 | 16.1 | 62.9 |
| October | 23.2 | 18.0 | 79.4 |
| November | 24.9 | 19.6 | 92.2 |
| December | 26.2 | 21.1 | 125.7 |
Source: Bureau of Meteorology, Cape Moreton Lighthouse, All years of record, series current to 2026. The lower rainfall figures in late winter and spring give a useful planning preference, not a promise of rain-free days. Read the temperature columns as air temperatures at the station; use sea-condition information for a water-based outing.
A weather-dependent boat trip
This Newport cruise includes guided wreck snorkeling and beach time, subject to conditions.
Hand-picked tours, booked through Viator. Prices are indicative starting prices in Australian dollars (as of October 2026). Tap a tour for live availability and the current price in your currency.
A weather-dependent snorkelling day from Newport
This outing includes guided snorkelling through the wrecks, equipment, educational commentary, lunch and island beach time. It starts at Newport Marina on the Redcliffe Peninsula; conditions determine the water experience.
Plan boat days around the forecast
For a snorkelling trip, choose the programme and departure point first, then review the current weather and sailing arrangements. The Newport outing combines a guided wreck snorkel with equipment, lunch, commentary and beach time. It is a sea-based day rather than an assurance of a particular month's underwater visibility. Compare boat-trip formats if you would like to understand how the time on the water differs between programmes.
Wreck snorkelling also requires attention to hazards that a warmer month does not remove. Safety guidance checked on 5 November 2026 identifies strong tidal currents and sharp, rusty metal around the wrecks. Follow the briefing and local signs. Plan swimming with a buddy and supervise children. Beaches are generally unpatrolled, with a limited summer and Easter school-break exception at The Wrecks.
Regional cyclone season and changing conditions
As checked on 5 November 2026, the official Australian tropical cyclone season runs from November to April. Treat this as a regional planning framework. It is not a prediction for an island visit or a yearly closure schedule. Consult current Bureau of Meteorology warnings and park conditions before travelling, especially when your plan depends on a boat crossing or independent island driving.
For a vehicle stay, weather planning belongs alongside the tides and the current route conditions. A drier monthly average does not establish that a beach route is passable. Keep your booked return sailing and island route in the same plan. The national park page explains driving requirements, while the ferry page helps you allow for the correct terminal and check-in.
Match the month to the activity
For walking and camping, compare the cooler part of the year with the warmer air temperatures in the table, then pack for the forecast. Bring sufficient drinking water and use a hat, covering clothing, shade and sunscreen even under cloud. A landscape photograph or a dry monthly average should not decide your sun protection or water supply.
If seasonal wildlife watching matters to you, keep it separate from the rainfall comparison. Cape Moreton offers seasonal opportunities to look for whales from land, but any sighting depends on the animals. Consult the wildlife guide for the difference between a coastal lookout and a marine-discovery outing. Choose dates around the experience you want, while leaving the day-to-day decisions to current conditions.
Questions about weather and timing
Which months are relatively dry?
August to October is relatively drier than most January to June months in this long-term Cape Moreton record. September has the lowest mean rainfall. Rain remains possible on your dates.
Does the table show sea temperatures?
The temperature columns show mean daily air-temperature maxima and minima at Cape Moreton Lighthouse. Use a current marine forecast and the activity briefing for your boat day.
Is winter a guarantee of clear snorkelling water?
Choose your trip using the current sea and weather conditions. Monthly air temperatures and rainfall do not establish the visibility you will find at the wrecks.
Does cyclone season mean the island closes?
November to April is the regional tropical cyclone-season framework. Follow current warnings, park conditions and your transport arrangements for the actual visit.